Introduction
Large language models (LLMs) have revolutionized AI applications, and llama.cpp stands out as a powerful framework for efficient, cross-platform LLM inference.
At the core of llama.cpp is ggml, a highly optimized tensor computation library written in pure C/C++ with no external dependencies. Gaining a deep understanding of GGML is essential for comprehending how llama.cpp operates at a low level. This blog series aims to demystify GGML by examining its source code, breaking down its design, and exploring the principles behind its performance optimizations.
This series will focus on the overall architecture and core logic of the GGML framework, covering key components such as GGUF file parsing, memory management and layout, computational graph construction, and execution flow. It will not cover theimplementation details of operators like matmul— I’ll probably explore that topic in a separate series once this one is complete. The goal here is to provide a high-level understanding of GGML’s design and workflow.
In this first post, we’ll begin with the fundamentals: setting up the development environment for source code reading. Let’s get started!
Note: GGML is actively evolving, and changes ranging from symbol renaming to large-scale refactoring can occur. This blog series is based on commit 475e012. For a smoother reading experience, it is highly recommended to use the same commit.*
Environment Setup
Operating Systems
Since ggml supports virtually all mainstream platforms, the choice of operating system is flexible — you can use Linux**,** Windows**,** or macOS without any issues. For this blog series, I will be using macOS to demonstrate the debugging process, but the steps outlined here apply to other platforms as well.
Compilation Tools
GGML does not have strict requirements for c++ compilers or toolchains, so you can use whichever compiler (gcc, clang, msvc, etc.) readily available on your system. To build the project, you also need to install:
CMake(required for configuring the build system)ccache(optional, but recommended for faster compilation)
IDE & Debugging Tools
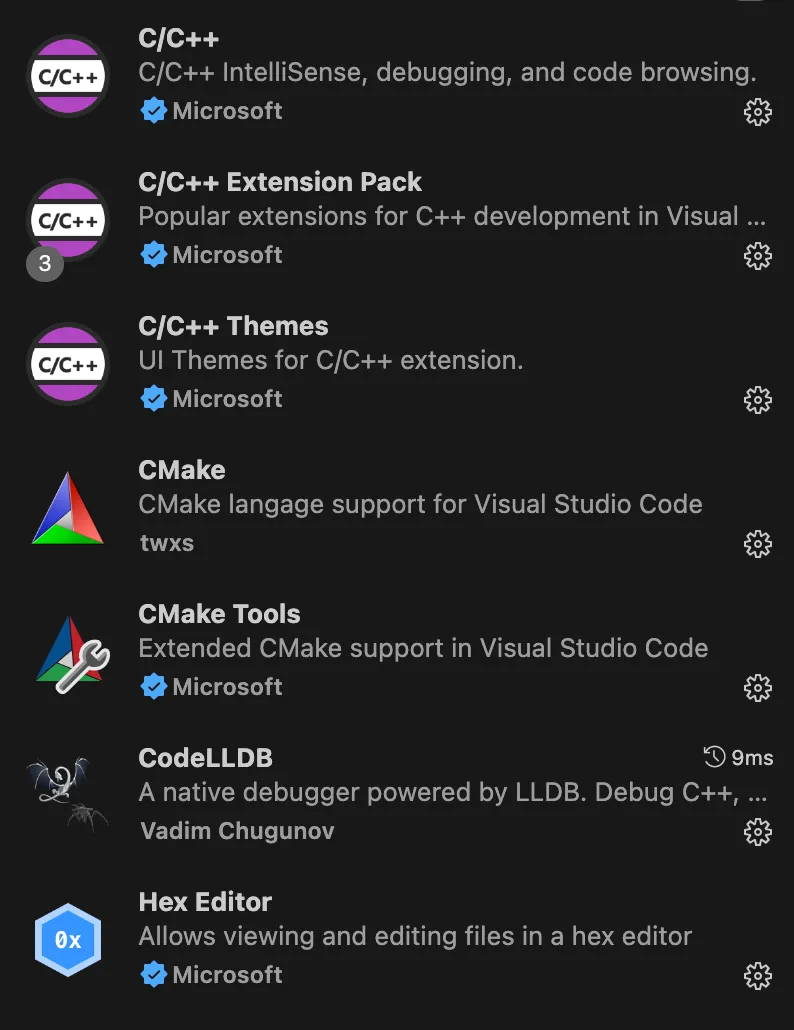
For debugging, you can use gdb or lldb directly if you’re comfortable with them. But for this blog post, I will be using VSCode to set up the development environment. If you choose the same, I suggest installing the following extensions:
- C/C++ (for code navigation and debugging)
- CMake (for working with CMake projects)
- CodeLLDB (if you prefer using LLDB)
- Hex Editor (optional but highly recommended — later in the series, we’ll use it to inspect GGUF binary files)

With everything set up, we’re now ready to explore the ggml repository itself.
Setting Up GGML
This blog post assumes you already know basic usage of git. First, clone the repository to your local environment and checkout to the commit we are going to use:
git clone git@github.com:ggml-org/ggml.git
git checkout 475e012
Enabling Debug Symbols
Unlike interpreted languages like Python, debugging c/c++ requires including debug symbols in binaries to enable source-level debugging. Without these symbols, debuggers will only display assembly code, definitely not what we want to see : )
To include debug symbols, a simple approach is to modify the project’s main CMakeLists.txt by adding the following lines:
set(CMAKE_CXX_FLAGS_DEBUG "${CMAKE_CXX_FLAGS_DEBUG} -g")
set(CMAKE_C_FLAGS_DEBUG "${CMAKE_C_FLAGS_DEBUG} -g")
This enables debug flags for the ggml shared library, which is essential but not sufficient for our needs. The actual target we will debug is not the shared library itself but the executables defined in ggml’s ./examplesfolder. To perform source-code level debugging, debug symbols must also be included for these executables.
For instance, to debug the simple-ctxexecutable generated by ./examples/simple, modify its CMakeLists.txtas follows:

Configuring VSCode for Debugging
If you’re using VSCode for debugging, you also need to set up a launch.json configuration file inside the .vscode folder for visual debugging. For example, to debug the simple-ctx example, you can use the following configuration:
{
    "version": "0.2.0",
    "configurations": [
        {
            "name": "debug simple-ctx",
            "type": "lldb",
            "request": "launch",
            "program": "${workspaceFolder}/build/bin/simple-ctx",
            "cwd": "${workspaceFolder}"
        }
    ]
}
Building the Project
To build ggml, refer to the README in ggml’s repo and use the appropriate build arguments for your platform. Once the build is complete, all executable files defined under ./examples/ will appear in ./<build_dir>/bin/.
Testing
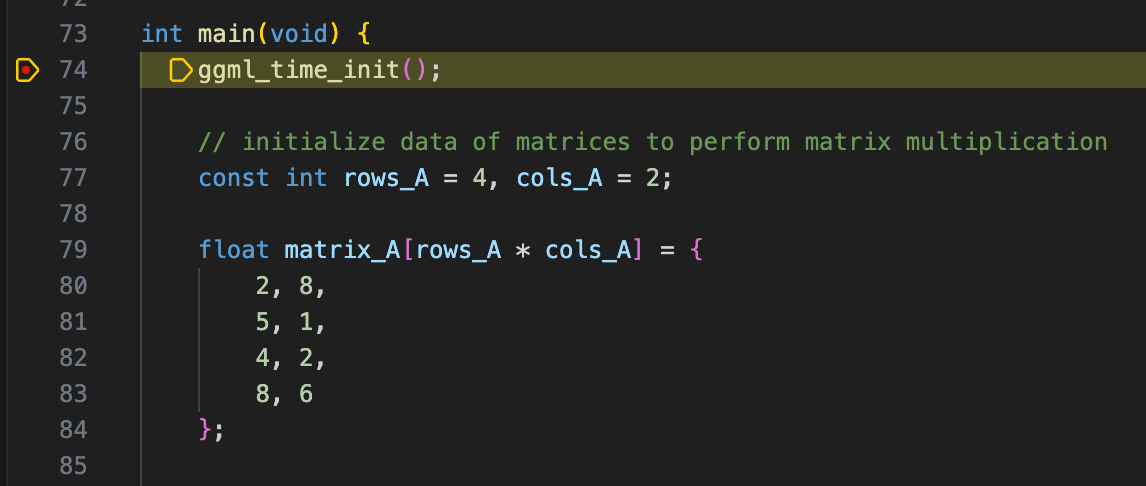
Ok, now everything is all set, time to test if the environment actually works! Set a breakpoint in the simple-ctx source code and run simple-ctx in VSCode’s debug panel. If everything is configured correctly, the execution should halt at your breakpoint.

Wrapping Up
Congrats! With the environment fully configured, we are now ready to explore GGML in action. In the next post, I’ll start by walking through examples provided by GGML, demonstrating its workflow and memory layout in both context-only mode and backend mode, stay tuned!
